ARES-M: Atmospheric Remote Environmental System for Mars
Technical Documentation
This page includes documentation for ARES-M: Atmospheric Remote Environmental System for Mars, submitted for the Hardware track at the SMathHacks 2025 hackathon. Our team members include Richard Shan (primary contact), Aaditya Sah, Trevor Bedson, and Josh Chilukuri. Our project, ARES, is a remote autonomous sensor suite for Mars, monitoring temperature, humidity, seismic activity, UV/IR, and soil moisture in real time to advance planetary science and environmental research. SMathHacks 2025 was hosted 2/8/2025 to 2/9/2025.
For a short summary, our project video, final product, and key images can be seen in the media gallery, accessible by clicking the arrows on either side of the video shown above. Note that the video is an ABRIDGED SUMMARY of the work done, and that the technical documentation is a far more comprehensive resource. Due to limited time, we also recognize that the technical documentation lacks full coverage, but it covers all important steps.

ARES is an integrated hardware-software solution featuring a remote sensor suite to detect temperature, humidity, seismic activity, and soil moisture monitoring on Mars. The nature of ARES' scalable mesh network deployment enables real-time environmental data acquisition across a distributed sensor array on multiple varied geographic locations simultaneously. A geospatially interactive interface allows users to access and analyze live telemetry along with a visualization of recently recorded data.
Judge and User Guide
Although ARES is at heart, a hardware project, we recognize that it is difficult to judge hardware projects remotely and asynchronously, without access to the hardware and guarantees that it is on and running. Thus, we developed a fully integrated frontend which is publicly accessible here.
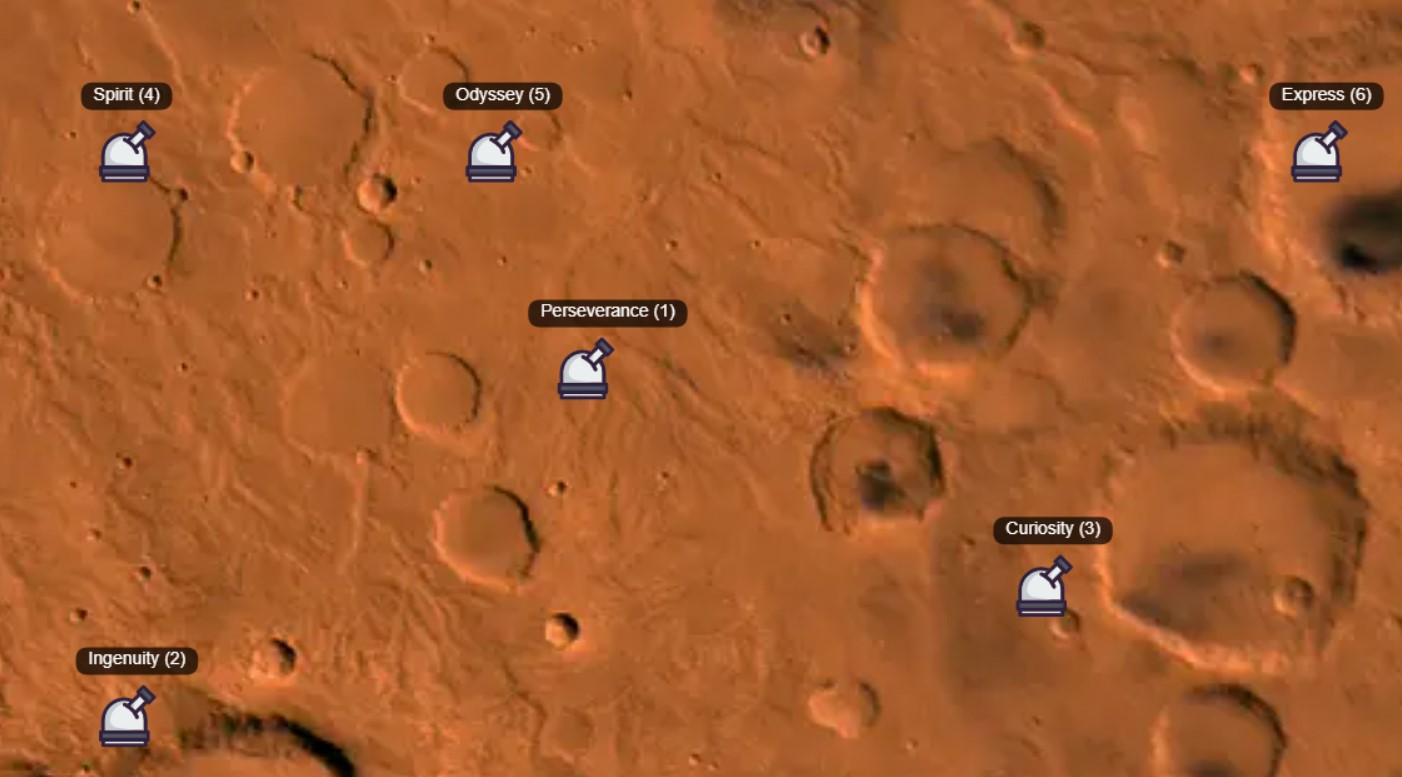
Clicking any of the stations opens a menu on the left side of the screen. The icons in the toolbar represent:
| Icon | Displayed Information |
|---|---|
| Mars Planet Icon | Home |
| Radio Tower Icon | Pod Latitude/Longitude Info |
| Plant Icon | Live Soil Moisture Over Time Info |
| Sun Icon | Live IR and UV Measurements Over Time Info |
| Wind Icon | Live Temperature and Humidity Data Over Time |
| Home Icon | Live Status of Earthquakes and Seismic Activity |
During the hackathon, we had time to develop one functional ARES prototype. If ARES is currently on, Perseverance's (Station 1) information and charts will be updated in live time. More realistically, ARES will not be plugged in when judging takes place (as I do have school) and Perseverance (Station 1) will be showing information from the last 10 times ARES sent back data. As we only developed one prototype, Stations 2-6 are displaying simulated data and do not reflect real world information. We simulate the other stations to demonstrate our mesh network proof-of-concept for peer-to-peer information transfer between ARES Pods.
This will make a lot more sense after reading the rest of the documentation.
Intended Usage
ARES is designed to be deployed as a system of dozens or hundreds of pods on the surface of a planet, i.e. Mars. Conventional sensing robots and systems are only able to track a single location (the current location of the rover). ARES' novel approach of building a peer-to-peer mesh network allows the deployment of hundreds of sensors across a large area of Mars, that all concurrently stream data to our frontend data tracker. ARES can be dropped by a rover or dropped out of the sky into remote and unreachable locations, and is able to continuously monitor temperature, humidity, seismic, UV, IR, and moisture levels of its location. ARES is a first-of-a-kind approach to long-term scalable environmental pattern monitoring across a large and distant area.
Inspiration
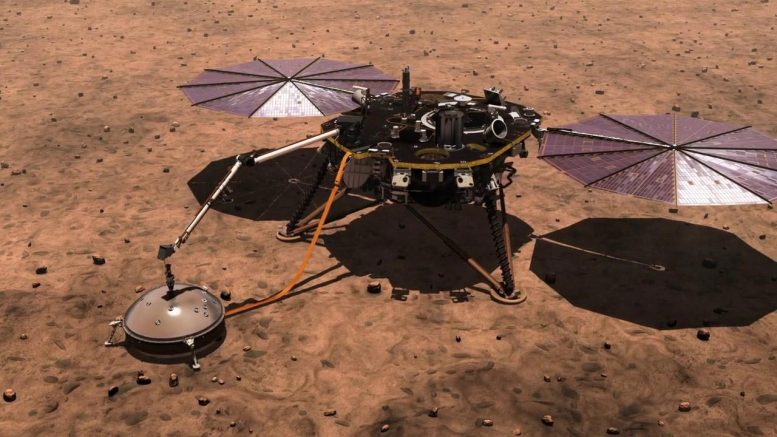
The idea for ARES emerged from the need for a more efficient and scalable approach to environmental monitoring on Mars. Existing planetary weather stations such as NASA’s InSight lander and Curiosity’s REMS provide valuable atmospheric and seismic data but are limited in coverage and flexibility. InSight, for example, offers stationary readings from a single location, while Curiosity’s sensors can only gather data wherever the rover happens to be. These limitations pose challenges for understanding global weather patterns, seismic activity, and potential water presence on Mars. Given the planet’s extreme conditions—dust storms, drastic temperature shifts, and geological activity—there is a critical need for a distributed, autonomous sensor system capable of continuous real-time data collection across multiple locations.
ARES was designed to address these challenges through a scalable mesh network of remote sensor pods that can be deployed across varied Martian terrain. These pods continuously monitor temperature, humidity, seismic activity, and soil moisture, providing high-resolution environmental data to researchers. AI integration allows for real-time processing, adaptive calibration, and anomaly detection, enhancing data accuracy and reliability in Mars’ harsh conditions. The system is paired with a geospatial visualization platform, enabling users to interact with a live map of Mars, click on sensor locations, and access real-time environmental data streams. Inspired by terrestrial meteorological and seismic networks, ARES brings a planetary-scale sensing solution to Mars, laying the groundwork for future habitat planning, climate research, and exploration missions.
Ideation
Our initial vision for ARES was centered on creating a comprehensive atmospheric and environmental monitoring system, with a strong focus on air quality analysis. Originally, we planned to incorporate sensors for volatile organic compounds (VOC), carbon dioxide (CO₂), and particulate matter (PM2.5/PM10) to better understand Mars’ atmospheric composition and potential hazards. These sensors would have allowed us to analyze dust composition, detect trace gases, and assess air quality, providing insights into both habitability and long-term climate trends on the planet. However, we faced a lot of logistical challenges considering our timeframe was only 2 days long. Our ordered sensors did not arrive in time, and forced us to adapt our approach while maintaining the core functionality of the system.
To ensure that ARES remained a robust and scientifically valuable solution, we pivoted to include sunlight sensors (UV/IR) and seismic monitoring instead. This adjustment allowed us to capture even more important environmental data despite our sensors not being shipped properly. Specifically, ultraviolet and infrared radiation monitoring is particularly relevant for Martian exploration since it helps assess surface conditions, radiation exposure risks for future missions, and potential atmospheric dust interactions. The shift also streamlined our hardware integration as it allowed us to develop and assemble the entire device without having any uncertainty about parts. While our final implementation has slightly different measurements than my original plan, our central idea remains the same and our changes have only reinforced the robustness of ARES.
CAD
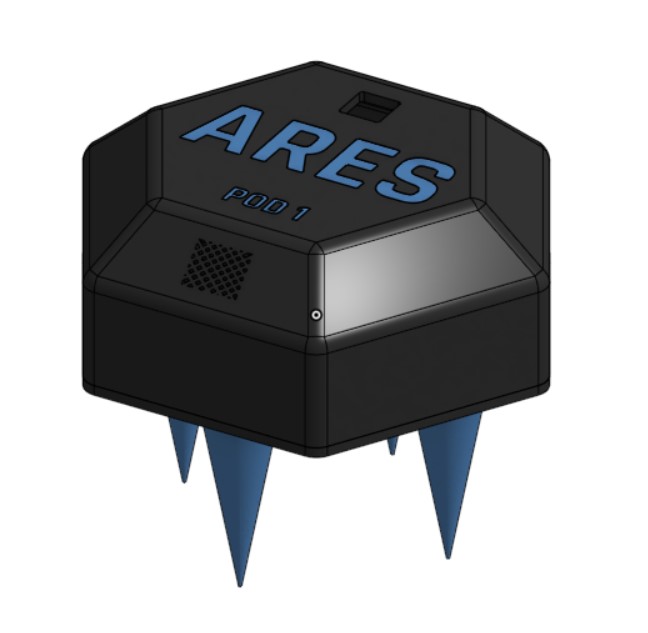
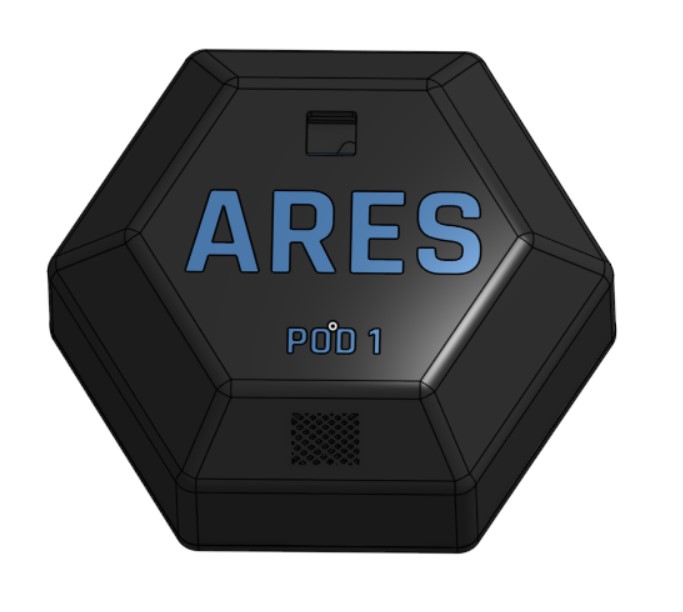
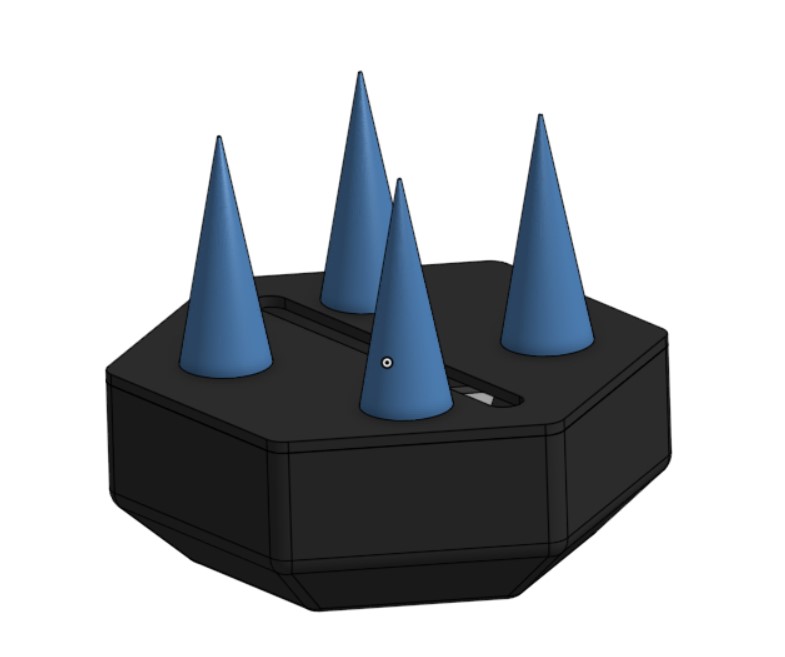
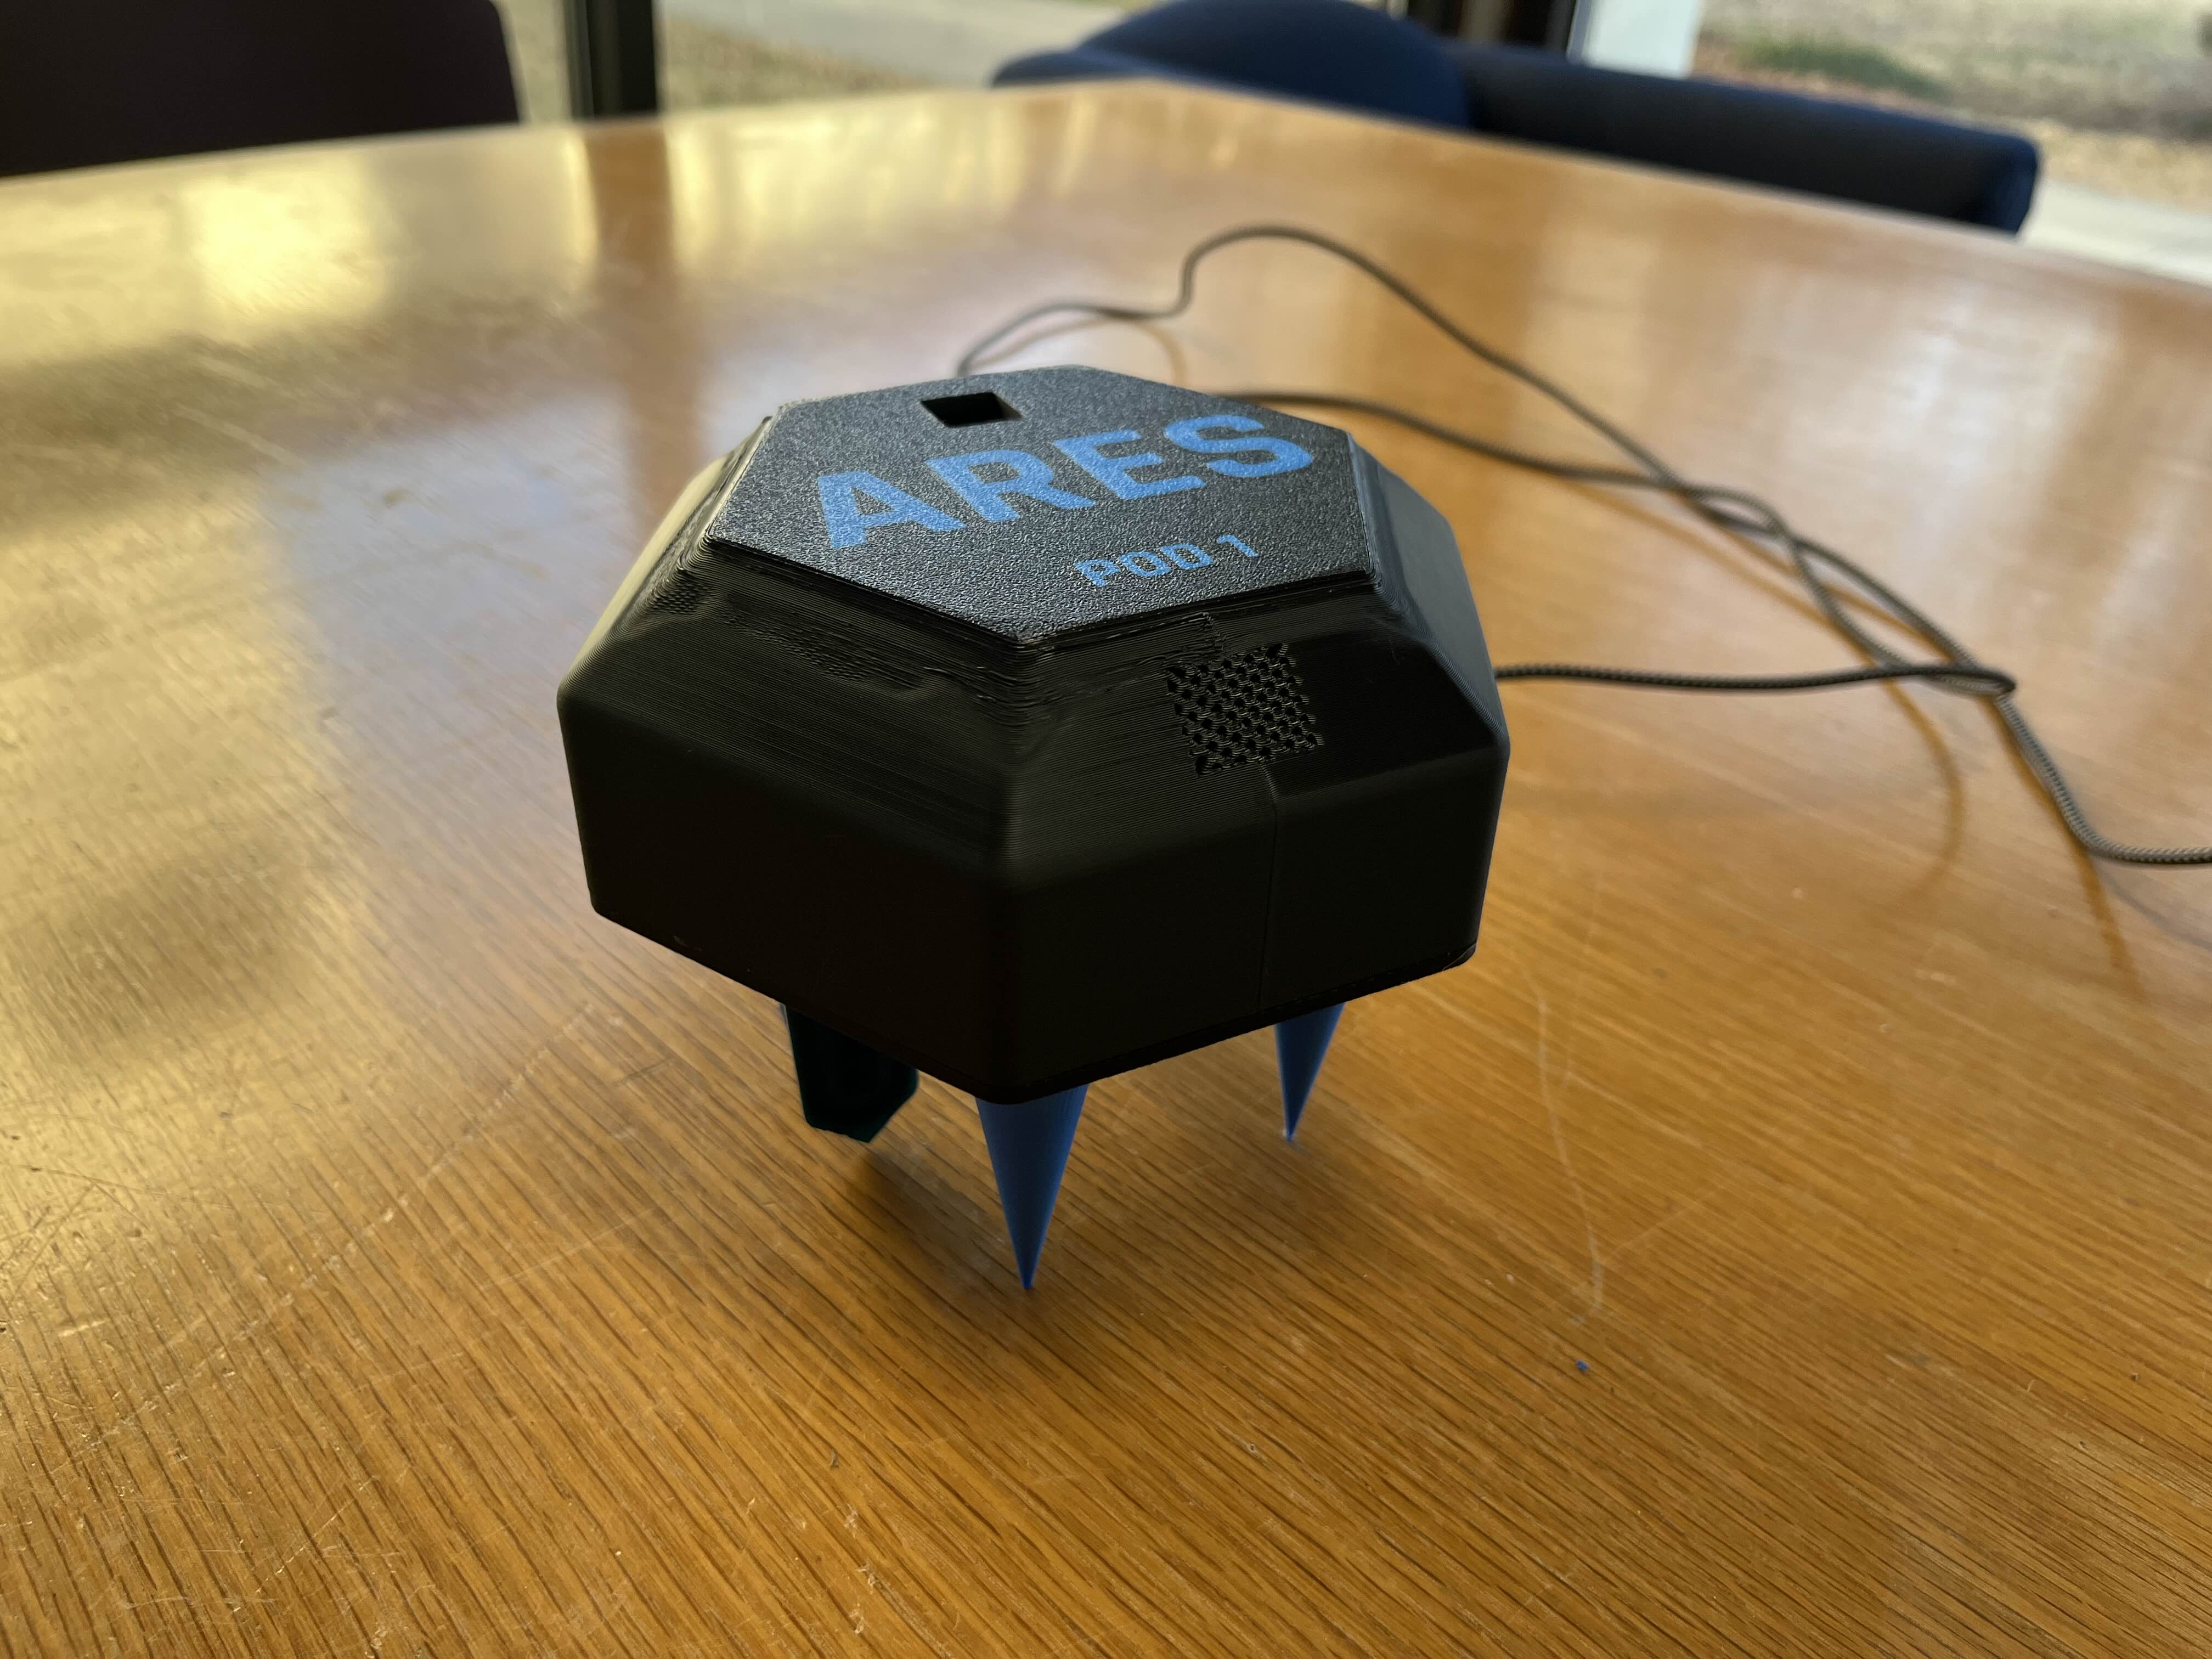
Since we developed the entire device in only two days, we created a simple yet highly effective and theme-matching CAD model. We created a hexagonal case for our electronics, with spots on the top for the sunlight and temperature/humidity sensor, as those needed access to light or the air respectively. We created an opening on the bottom of the hexagonal case for the soil moisture sensor to be deployed from. Spikes were added on the bottom as a way for the device to mount into extraterrestrial soil when dropped from a decent height, and serves to secure the device in place. We notate the ARES name and Pod number on the top of each individual pod.
Internally, we designed mounts for the temperature/humidity sensor, sunlight sensor, and the MPU6050. The temperature/humidity sensor mount is shown on the left side of this image, and has a mesh on top of it so that the sensor is not completely exposed to the elements whilst also being able to access air for measuring humidity and temperature. The sunlight sensor mount is on the right side of this internal image, and faces directly upward into the sky to access the light. In production, we put a section of clear tape over the hole so that the sensor is protected while also being able to access its necessary measurements. The accelerometer and gyroscope sensor is mounted to the print directly, and is aided in contact area by the mount located in the upper right extrusion in this image. The servo is mounted in production directly to the print.
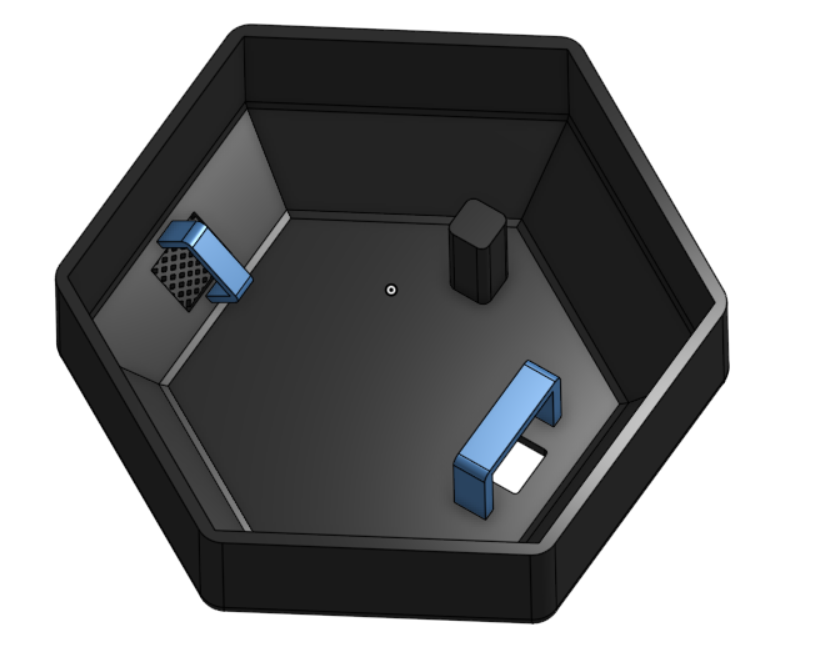
The locations for the temperature/humidity sensor and sunlight sensor are clearly visible in the top view of the design. The mesh underneath the Pod 1 label houses the temperature/humidity sensor. The small cutout above the ARES insignia is where the sunlight sensor is mounted, and protected by a tape-over.
Finally, we added spikes on the bottom to act as stakes to secure the ARES Pod to the ground, and protect it in dangerous Martian conditions such as storms and earthquakes. It is important that ARES is able to survive these events and continue transmitting data, as gathering data about these abnormalities is a key application of ARES.
Sensors Analysis
We plan to be able to measure temperature, humidity, seismic activity, sunlight levels, and soil moisture levels. Temperature and humidity are crucial for understanding environmental conditions, predicting weather patterns, and assessing habitability for both equipment and potential life. Seismic activity measurements help detect ground vibrations, assess tectonic movement, and analyze subsurface structures, providing insights into planetary formation and stability. Sunlight levels, particularly UV and IR radiation, are key for evaluating solar energy availability, studying atmospheric interactions, and identifying potential hazards due to high radiation exposure. Soil moisture detection allows for assessing water content, determining surface composition, and identifying potential regions for resource utilization, which is essential for astrobiology and future exploration. The following table illustrates our choice of sensor based on their availability in a short time frame and their capabilities.
| Measurement Type | Sensor Model | Parameters Measured | Communication | Notes |
|---|---|---|---|---|
| Temperature | DHT11 | Temperature (°C) | Digital | Used for recording temperatures |
| Humidity | DHT11 | Relative Humidity (%) | Digital | Integrated with temperature sensor |
| Seismic Activity | MPU6050 | Acceleration (X, Y, Z), Gyro (X, Y, Z) | I2C | Used to detect ground vibrations & movement, important for measuring seismic activity on Mars |
| UV & IR | SI1145 | UV Index, Infrared | I2C | UV and IR have many uses. Some include the ability to assess habitability, detect water ice, track dust storms, and optimize solar power for future exploration. |
| Soil Moisture | Capacitive Soil Moisture Sensor | Soil Moisture Level | Analog | Moisture level is based on capacitance, which correlates with water concentration level. Measuring soil moisture on Mars and exoplanets aids in detecting water, analyzing geochemistry, and identifying potentially habitable environments for microbial life. |
We ensure that the sensors we want to use are available. We thank Mr. Michael D’Argenio from NCSSM for securing access to the hardware necessary for this project.
| Metric | Relevant Sensors | Available |
|---|---|---|
| Temperature | DHT11 | ✅ |
| Humidity | DHT11 | ✅ |
| Seismic Activity | MPU6050 | ✅ |
| UV Radiation | SI1145 | ✅ |
| Infrared Radiation | SI1145 | ✅ |
| Soil Moisture | Capacitive Soil Moisture Sensor | ✅ |
Now that we know what sensors we will use, we will analyze their pinouts and datasheets to ensure that we are able to implement them with the chip we want to develop on (Xiao Seeed ESP32S3). We would prefer to run the sensors at 5V, but do have a 3V3 available.
| Sensor Model | Communication | Pinout | Power | Datasheet |
|---|---|---|---|---|
| DHT11 | Digital (Single-wire) | VCC, GND, Data | 5V | DHT11 Datasheet |
| MPU6050 | I2C | VCC, GND, SCL, SDA, INT | 5V | MPU6050 Datasheet |
| SI1145 | I2C | VCC, GND, SCL, SDA | 3.3V | SI1145 Datasheet |
| Capacitive Soil Moisture Sensor | Analog | VCC, GND, Analog Output | 3.3V | Capacitive Soil Moisture Sensor Datasheet |
Now that we've verified the feasibility of our project in theory, it is time to implement it. Note that we implemented a wind speed tracker in the GUI expecting the sensor to arrive the afternoon of 2/9, but it never arrived. Thus, we simulate wind speed data in the frontend interface. Wind speed data is not taken from our sensors and does not represent real world information.
Electrical Engineering
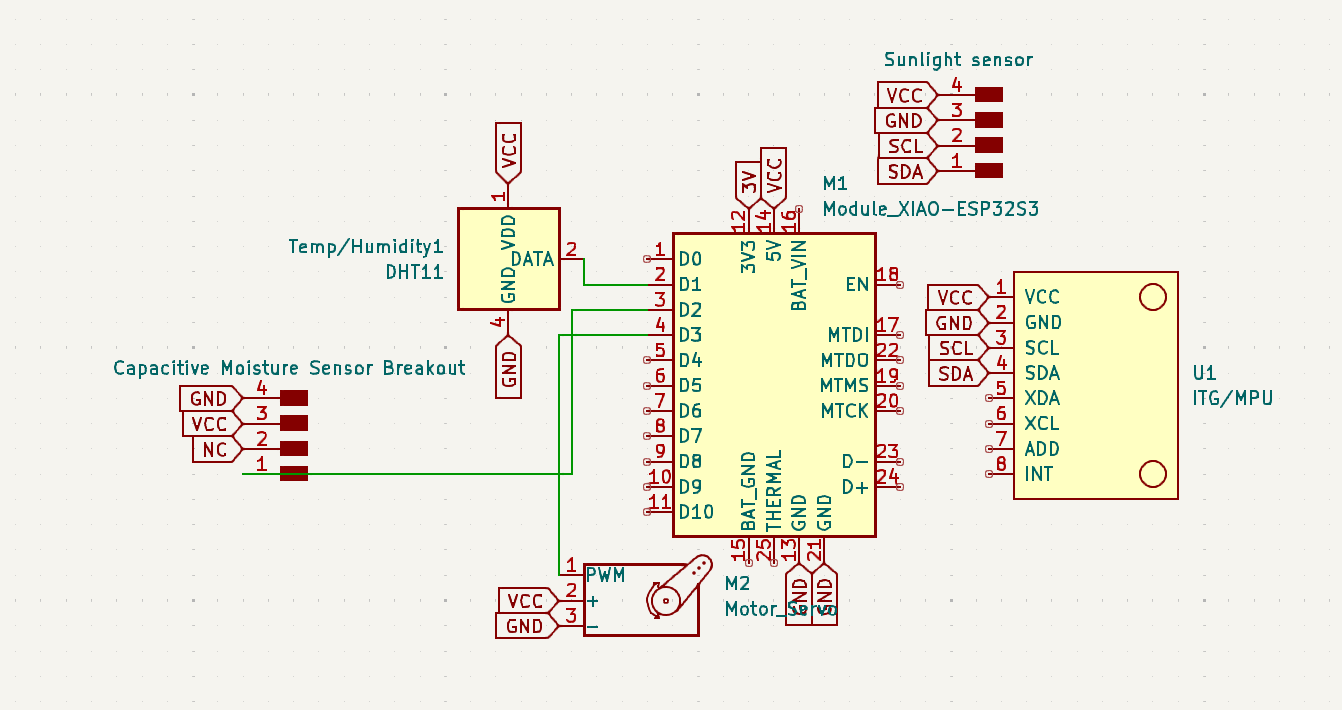
We first assembled the entire circuit in a basic schematic to plan out everything. Unfortunately, during these two days we were unable to access a desktop CNC machine to mill a PCB, so we decided to not create an actual board design to save time and instead simply referred to the schematic during design and soldering. Due to limited time and lack of needing a proper PCB, Richard decided to forego foraging for footprints and instead spoofed them with labelled conn headers corresponding to sensor pinouts, a strategy that saved time and is sufficient for our current situation. In the future, we plan to continue this project after the hackathon and will design a PCB proper for production.
Before we assembled the finalized soldered circuit, we first tested using a test ESP32 Feather V2 board on a breadboard circuit. We used the same wiring that would be our final design, excepting the servo. We later decided to implement a servo mechanism to lower the soil moisture sensor into the soil itself, to get more accurate readings.
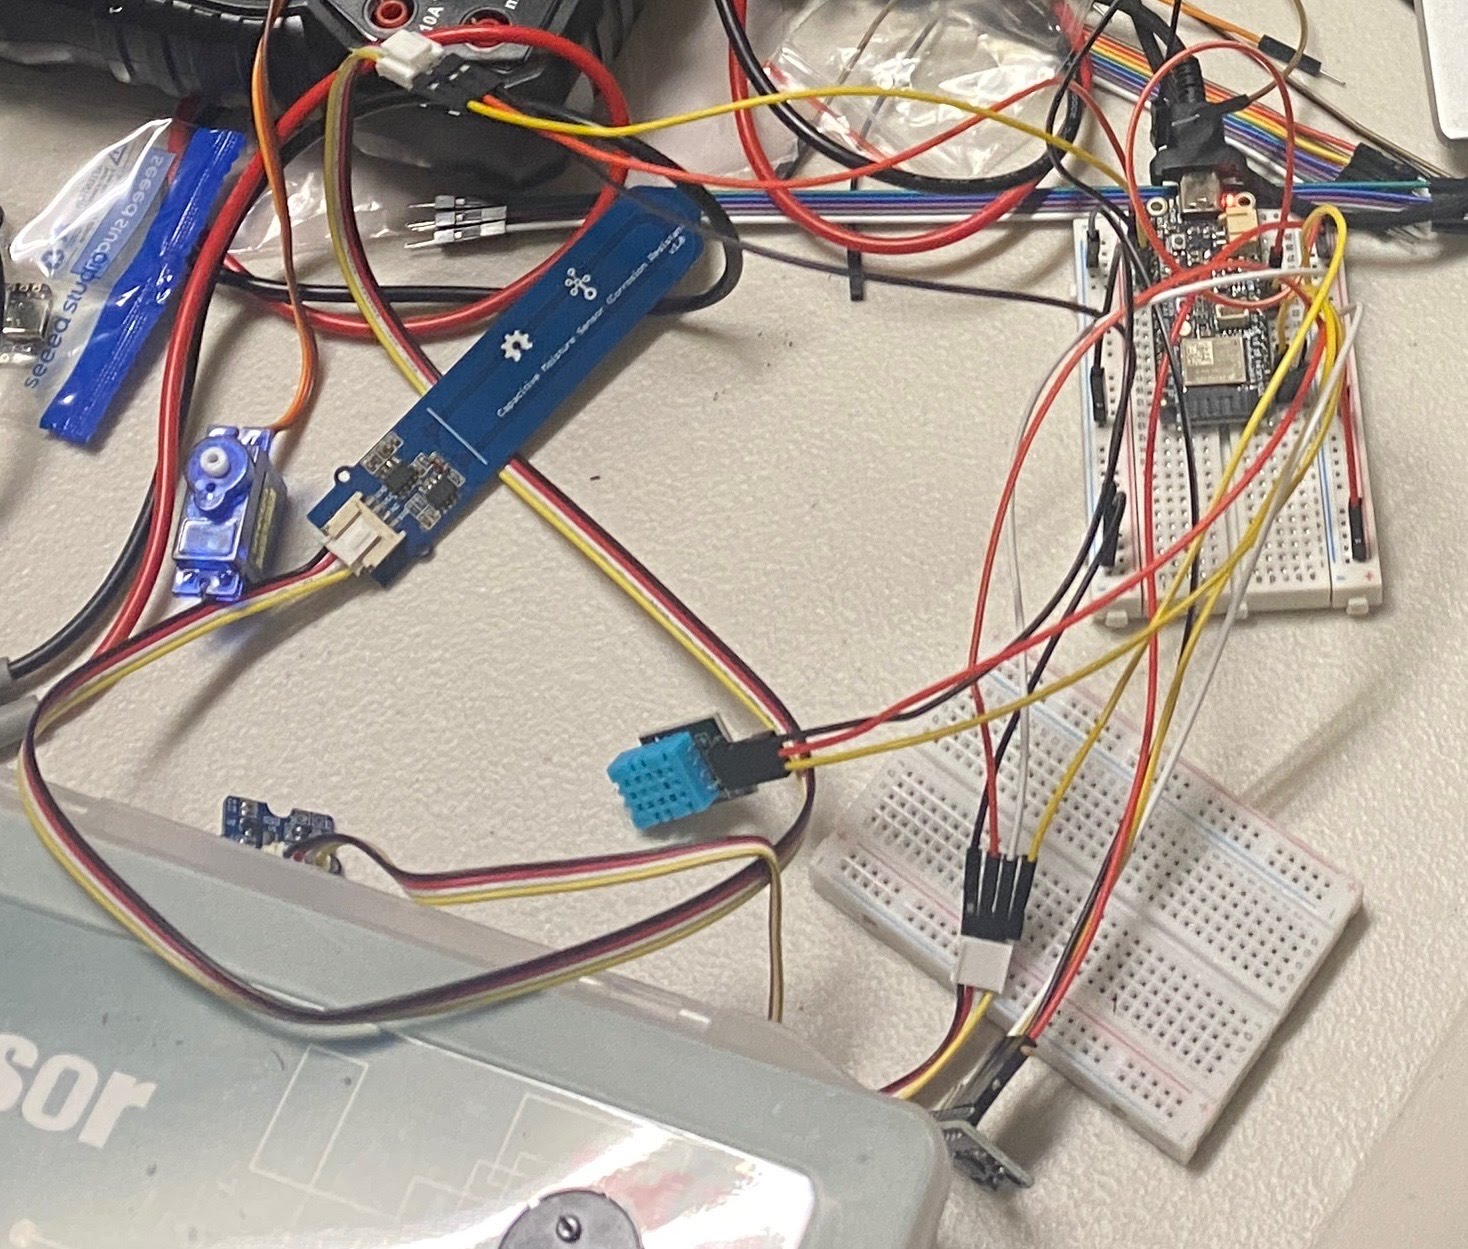
As the ESP32 Feather V2 board was NCSSM property, we switched over to a spare Xiao Seeed ESP32S3 chip that Richard had. We chose the ESP32 architecture due to its native Wi-Fi capabilities, as we knew we would send data over a wireless network to the frontend. This involved minor changes in our code, discussed later. Here is what our circuit looks like when it is integrated into the system. We strove for color-coding wires properly, but had to prototype without a PCB. Alas!
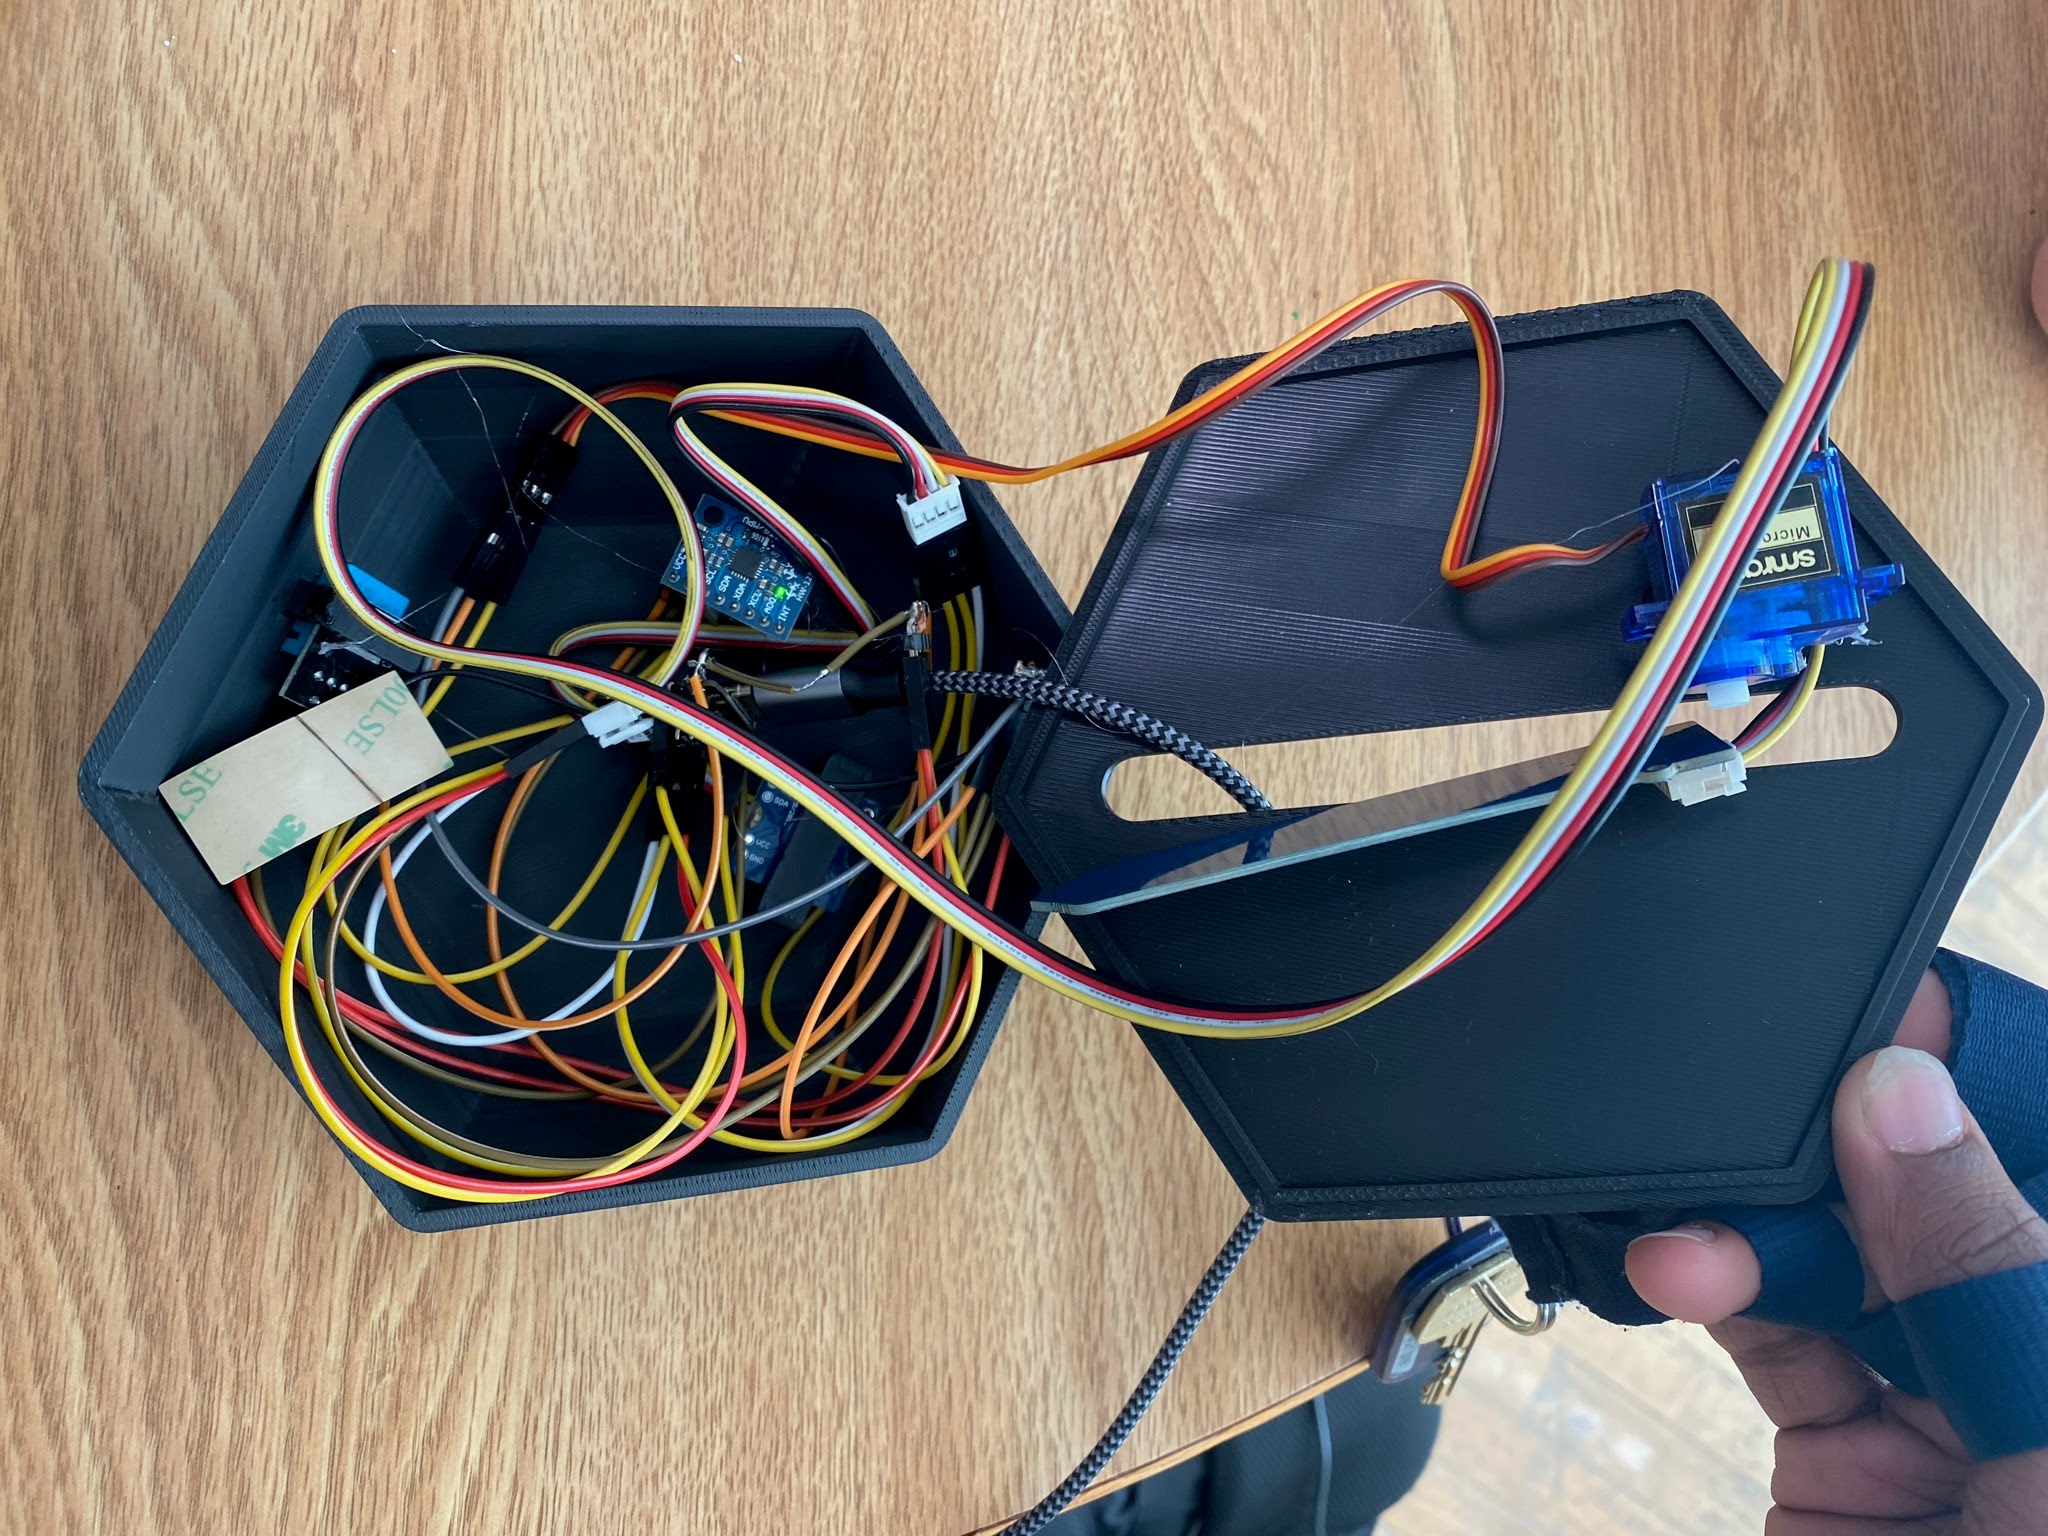
As discussed earlier, we now implement a servo on the bottom of ARES to allow the soil moisture sensor to be deployed into the soil without being harmed by the initial ground impact. Devpost unfortunately doesn't allow for video displays in Markdown, so a short video of the servo in action can be found here. The following image shows the servo in the fully extended position with the moisture sensor at its furthest point in the ground.
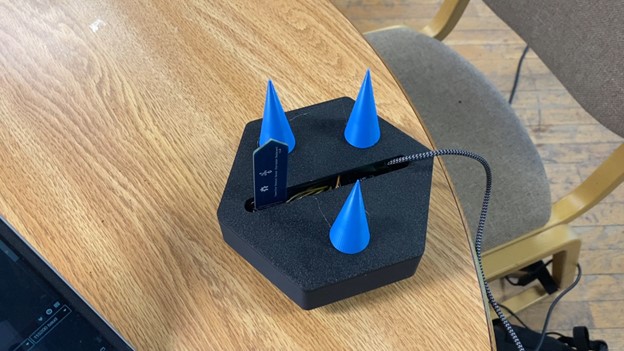
The following is a picture of our final product, placed on a table to emphasize the under-body spikes and moisture sensor positioning. In practice, the body of ARES sits above ground, while the spikes serve as stakes to secure ARES in place and the moisture sensor is underground to fulfill its mission of water detection.
Backend Software
Our following ESP32-based embedded system script establishes a Wi-Fi connection to facilitate remote environmental and motion data acquisition, processing, and transmission. It integrates multiple sensor modalities, including an MPU6050 inertial measurement unit (IMU) for three-axis acceleration and angular velocity, a DHT11 for temperature and humidity sensing, an SI1145 for ultraviolet (UV) and infrared (IR) irradiance measurement, and a capacitive soil moisture sensor for substrate hydration assessment. A servo motor is utilized for lowering the soil moisture sensor into the ground for more accurate readings.
The system utilizes I2C communication protocol to acquire real-time sensor readings, which are encapsulated within a structured JSON object via the ArduinoJson library. This JSON payload is transmitted via an HTTP POST request to a remote server hosting the frontend API endpoint and is secured through authentication tokens. The pod transmits data through the mesh network to the endpoint every 5 seconds to ensure live-time data measurements. The system concurrently logs network status and signal strength to the serial interface for diagnostic purposes, since we experienced many issues with Wi-Fi during development.
#include <WiFi.h>
#include <HTTPClient.h>
#include <ArduinoJson.h>
#include <Wire.h>
#include <Adafruit_MPU6050.h>
#include <Adafruit_Sensor.h>
#include <dht11.h>
#include "SI114X.h"
#include <ESP32Servo.h>

// Wi-Fi Credentials
char ssid[] = "redacted";
char pass[] = "redacted";


// API Endpoint and Auth
const char* serverURL = "https://mars.prorickey.xyz/api";
const char* authToken = "CYcagejUv3tJwTfEQMWxrF2ALnkVm87RP5hNybHZBDXdGu9zsK";

// MPU6050 (Gyroscope/Accelerometer)
Adafruit_MPU6050 mpu;

// DHT11 (Temperature/Humidity)
#define DHT11PIN 3
dht11 DHT11;

// SI1145 (Sunlight sensor)
SI114X SI1145 = SI114X();

#define SERVO_PIN 1

Servo myServo;

// Soil Moisture sensor (analog pin A3)
const int moisturePin = 4;

void setup() {
  // ----- Serial & Wi-Fi Setup -----
  myServo.attach(SERVO_PIN);
  Serial.println("Servo initialized successfully!");
  myServo.write(0);

  Serial.begin(115200);
  while (!Serial) { }

  Serial.print("Attempting to connect to SSID: ");
  Serial.println(ssid);

  //WiFi.useStaticBuffers(true);
  WiFi.mode(WIFI_STA);
  WiFi.begin(ssid, pass);
  while (WiFi.status() != WL_CONNECTED) {
    delay(500);
    Serial.print(".");
  }

  delay(500);

  Serial.println("");
  Serial.println("Connected to WiFi");
  printWifiStatus();

  myServo.write(90);
  Serial.println("Moving to Down (90°)");
  delay(1000);  // Hold for 1 second

  // ----- I2C Initialization -----
  Wire.begin();

  // ----- Sensor Initialization -----
  Serial.println("Initializing sensors...");

  // MPU6050 Initialization
  if (!mpu.begin()) {
    Serial.println("Failed to find MPU6050 chip");
    while (1) { delay(10); }
  }
  Serial.println("MPU6050 Found!");

  // Set MPU6050 ranges and bandwidth
  mpu.setAccelerometerRange(MPU6050_RANGE_8_G);
  mpu.setGyroRange(MPU6050_RANGE_500_DEG);
  mpu.setFilterBandwidth(MPU6050_BAND_5_HZ);

  // SI1145 (Sunlight Sensor) Initialization
  Serial.println("Initializing SI1145 (Sunlight Sensor)...");
  while (!SI1145.Begin()) {
    Serial.println("SI1145 not ready, retrying...");
    delay(1000);
  }
  Serial.println("SI1145 is ready!");

  Serial.println("\nAll sensors initialized!\n");
  delay(500);
}

void loop() {
  unsigned long currentTime = millis();

  // ----- Read MPU6050: Acceleration, Gyro, and Internal Temperature -----
  sensors_event_t a, g, temp;
  mpu.getEvent(&a, &g, &temp);

  // ----- Read DHT11: Temperature and Humidity -----
  DHT11.read(DHT11PIN);

  // ----- Read SI1145: Visible Light, IR, UV -----
  uint16_t ir = SI1145.ReadIR();
  float uvIndex = SI1145.ReadUV() / 100.0;  // Convert raw value to UV index

  // ----- Read Soil Moisture Sensor -----
  int moistureValue = analogRead(moisturePin);
  int moisturePercent = map(moistureValue, 4095, 1200, 0, 100);
  moisturePercent = constrain(moisturePercent, 0, 100);

  // ----- Build JSON Object using ArduinoJson -----
  StaticJsonDocument<512> jsonDoc;
  jsonDoc["time"] = currentTime;
  JsonArray stations = jsonDoc.createNestedArray("stations");

  JsonObject station = stations.createNestedObject();
  station["id"] = "STATION_1";       // Changed based on which ARES Pod is programmed
  station["latitude"] = 0.1;           // Hard coded for hackathon proof of concept, varies in deployment
  station["longitude"] = 0.1;          // Hard coded for hackathon proof of concept, varies in deployment
  station["temperature"] = DHT11.temperature;
  station["humidity"] = DHT11.humidity;
  station["uv"] = uvIndex;
  station["ir"] = ir;
  station["moisture"] = moisturePercent;

  JsonObject accel = station.createNestedObject("accel");
  accel["x"] = a.acceleration.x;
  accel["y"] = a.acceleration.y;
  accel["z"] = a.acceleration.z;

  JsonObject angVelocity = station.createNestedObject("angVelocity");
  angVelocity["x"] = g.gyro.x;
  angVelocity["y"] = g.gyro.y;
  angVelocity["z"] = g.gyro.z;

  String jsonPayload;
  serializeJson(jsonDoc, jsonPayload);

  // ----- Send HTTP POST Request -----
  HTTPClient http;

  http.begin(serverURL);
  http.addHeader("Content-Type", "application/json");
  http.addHeader("Authorization", "Bearer " + String(authToken));

  int httpResponseCode = http.POST(jsonPayload);

  Serial.println("Sending JSON Data...");
  Serial.println(jsonPayload);

  if (httpResponseCode > 0) {
    Serial.print("Response Code: ");
    Serial.println(httpResponseCode);
    String response = http.getString();
    Serial.println("Server Response: " + response);
  } else {
    Serial.print("Error Sending Data. HTTP Response: ");
    Serial.println(httpResponseCode);
  }

  http.end();
  delay(1000);  // Send data every 5 seconds
}

void printWifiStatus() {
  Serial.print("SSID: ");
  Serial.println(WiFi.SSID());

  IPAddress ip = WiFi.localIP();
  Serial.print("IP Address: ");
  Serial.println(ip);

  long rssi = WiFi.RSSI();
  Serial.print("Signal strength (RSSI): ");
  Serial.print(rssi);
  Serial.println(" dBm");
}
Frontend
The front end was developed using a Next.js framework powered by React, Typescript, Tailwind CSS, and Post CSS. A Postgresql database was deployed using Docker to collect real-time live data from the sensor. To interact with the data, we used Prisma ORM and created our API for the embedded system to send information. We used the Chart.js library to create data visualizations.
Postgresql was chosen due to its proficiency in collecting time series and station data structures, which are highly compatible with the relational database and table. Postgresql’s rapid and efficient data storage also allowed us to answer API requests effectively. We deployed our application using docker-compose to securely isolate the database while maintaining client-server interaction. Our front and back end were deployed on a local server, making docker the ideal selection to optimize build speed..
We structured our database to have a table for each station, and specific weather data payloads. This decision allowed us to quickly select databases and find associated weather data by utilizing prisma’s include parameter when querying.
model Station {
 id   String @unique
 name String


 weatherData WeatherData[]
}


model WeatherData {
 id Int @unique @default(autoincrement())


 latitude  Float
 longitude Float


 station   Station @relation(fields: [stationId], references: [id])
 stationId String


 pressure    Float
 temperature Float
 humidity    Float
 co2         Float
 dust        Float
 wind        Float
 uv          Float
 ir          Float
 moisture    Float
 light       Float
 accelX      Float
 accelY      Float
 accelZ      Float
 angVelX     Float
 angVelY     Float
 angVelZ     Float


 timeTaken DateTime
}
We kept this structure consistent between internal data structures, and the format we receive data through the API. We originally included the position in the Station table, but later moved it to the time series data table to account for the stations being uprooted or relocated.
In our GET API route, we utilized Prisma’s powerful filtering features to limit and select specific items. We were able to take advantage of this because of our database structure choices. We filter by time, in ascending order, to select the latest entries, which have the largest time stamps. We further filter by only selecting the last 5 hours. Furthermore, we take the data, which contains 60 datapoints per second, and condense it down to 1 datapoint per minute using averages.
const data = await prisma.station.findMany({
  include: {
  weatherData: {
   orderBy: {
    timeTaken: "asc"
   },
   where: {
    timeTaken: {
     gte: new Date(new Date().getMilliseconds() - 1000 * 60 * 60 * 5)
    }
   }
  },
 }
})
Our POST API route is used to collect data from the station. It is designed to receive a request from our master node and contains the data for each of the pods. It includes very basic key bearer authentication that simplifies and protects our application. We chose the data structure for the payload in order to be consistent with internal data structures and the database structure, and it was easily implemented on the embedded system on our physical device. We also include data points for our simulated stations that slightly modify the actual data to simulate varying weather conditions in a region.
Our UI design choices were based on speed and efficiency. This is why we decided to go with Typescript, as its strongly typed nature allows us to identify type errors before we run code quickly. We also decided to use Tailwindcss in order to quickly style our components. Finally, Next.js allows us to quickly test, build, and deploy.
The web interface consists of an interactive map and a navigation bar containing information from the sensors. Different tabs display relevant charts and statistics for corresponding environmental measurements, including Earthquake detection (by calculating an aggregated average of accelerometer values), soil moisture percentage, average/max/min temperature and humidity, light wavelengths, and geographic position.
Using the library ChartJS alongside html canvas, we can create an interactive UI to showcase the data and allow users to vizualize ARES pods. ChartJS allowed us to quickly chart and format our data, and helped us greatly save time and create an appealing front end. Furthermore, html canvas allowed us to place the pods on the map in their exact positions based on their collected latitude and longitude.
Integration
The backend Arduino code integrates seamlessly with the frontend by using JSON as a standardized data format to transmit sensor information. Within the code, sensor readings from multiple devices—such as temperature, humidity, UV index, IR levels, soil moisture, and motion data from the MPU6050—are structured into a JSON document using the ArduinoJson library. This JSON payload encapsulates the sensor data along with metadata like timestamps and station identifiers, making it easy to manage and extend. Once the payload is constructed, it is serialized into a string and sent via an HTTP POST request to a remote API endpoint. This API, which is typically part of a backend service connected to the frontend, receives the JSON data and processes it accordingly. A sample JSON string which is transmitted will look like the following:
{"time":22651,"stations":[{"id":"STATION_1","latitude":0.1,"longitude":0.1,"temperature":23,"humidity":36,"uv":0.02,"ir":254,"moisture":52,"accel":{"x":1.019929886,"y":-0.325611442,"z":9.361329079},"angVelocity":{"x":-0.041834611,"y":0.022915773,"z":-0.007993874}}]}
On the frontend, the received JSON data can be parsed and dynamically rendered using modern web development frameworks and libraries such as React, Angular, or Vue.js. The structured JSON makes it straightforward for the frontend to extract specific sensor readings and display them in an interactive dashboard—using charts, graphs, and real-time status updates. This approach allows for scalable integration where additional sensor data or stations can be added without disrupting the data flow.
Impact
The integration of this system into an IoT-based monitoring framework has significant implications for real-time environmental sensing, data transmission, and decision-making. By systematically acquiring data from multiple sensors—including temperature, humidity, ultraviolet (UV) radiation, infrared (IR) levels, soil moisture, and motion tracking via the MPU6050—the system ensures a comprehensive representation of environmental conditions. The collected data is structured into a standardized JSON format, optimizing interoperability between hardware and software layers. Utilizing HTTP POST requests for data transmission enables continuous and automated logging, reducing the reliance on manual intervention and enhancing data accuracy. This approach facilitates real-time analytics and predictive modeling, supporting applications in smart agriculture, climate monitoring, and industrial process optimization.
From a systems engineering perspective, the use of JSON as a lightweight and structured data exchange format enhances system scalability and integration with web-based visualization tools. The modularity of the architecture allows for seamless expansion, enabling the incorporation of additional sensors without substantial modifications to the data processing pipeline. Furthermore, real-time data dissemination to frontend interfaces, such as interactive dashboards, enhances user engagement and decision support capabilities. This architecture enables advanced analytical techniques, including anomaly detection and machine learning-driven forecasting, by providing structured and time-synchronized datasets.
The system is designed for deployment on Mars, where real-time environmental monitoring is critical for both scientific research and mission sustainability. Mars presents a uniquely hostile environment with extreme temperature variations, low atmospheric pressure, high levels of ultraviolet and infrared radiation, and frequent dust storms. Continuous measurement of atmospheric conditions, radiation exposure, seismic activity, and soil moisture provides critical data for assessing planetary habitability, evaluating geological activity, and informing mission planning. The integration of the MPU6050 inertial measurement unit enables seismic detection, offering insights into subsurface dynamics that could inform structural stability assessments for future landing sites. Data collected from the system is structured in a lightweight JSON format, allowing for efficient transmission to orbiters, surface rovers, or Earth-based mission control centers, facilitating real-time analysis and remote decision-making.
Beyond its role in environmental sensing, this system supports the development of autonomous habitat management and resource utilization for sustained human presence on Mars. The ability to monitor radiation levels and atmospheric conditions enables predictive hazard detection, which is crucial for safeguarding both robotic and human-operated systems. Soil moisture analysis contributes to in situ resource utilization strategies, particularly in the search for accessible water reserves necessary for life support, agriculture, and fuel production. The modular architecture ensures adaptability for future missions, allowing for integration with additional sensor arrays suited to evolving scientific and operational requirements. The real-time data stream enhances mission oversight by enabling remote monitoring through interactive visualization platforms, ensuring continuous situational awareness. By providing high-resolution structured environmental data, this system advances the capability of autonomous exploration and habitat sustainability, supporting both near-term scientific missions and long-term human settlement on Mars.
Future Work
Future developments in this system can focus on enhancing data processing efficiency, expanding sensor integration, and improving real-time analytics capabilities. One key direction is the implementation of edge computing techniques to preprocess sensor data before transmission, reducing network congestion and minimizing latency in real-time applications. By incorporating onboard machine learning models, such as TinyML for anomaly detection or predictive analytics, the system could autonomously identify critical environmental changes and trigger automated responses. Additionally, improving the robustness of data transmission by implementing MQTT or WebSocket protocols could enable more efficient, low-latency communication compared to the current HTTP-based approach. Furthermore, integrating secure encryption mechanisms for JSON payloads and authentication protocols, such as OAuth 2.0, could enhance data integrity and privacy when transmitting sensitive environmental data to cloud-based platforms.
Work Distribution
| Task | Effector |
|---|---|
| Ideation | All |
| Documentation | Richard |
| Backend Software Development | Richard |
| Schematics | Richard |
| Sensors Analysis | Richard |
| Electrical Engineering | Richard, Aaditya |
| Networking and I2C | Richard, Aaditya |
| CAD | Aaditya |
| Moisture Servo Mount | Aaditya |
| System Integration | Richard, Aaditya, Trevor |
| Frontend Development | Trevor, Josh |
| API Development | Trevor |
| Video Script | Josh |
| Video Editing | Josh |
| Data Processing | Trevor, Josh |
| DevOps | Trevor |